
Tezos continued on its established path to the downside, with XTZ showing no signs of recovery, at the time of writing. Waves made strong gains in August, however, at press time, it showed a lack of momentum in the near-term, while generally trending south over the month. Zcash flashed a bullish signal, but the market climbed only momentarily before slipping.
Tezos [XTZ]
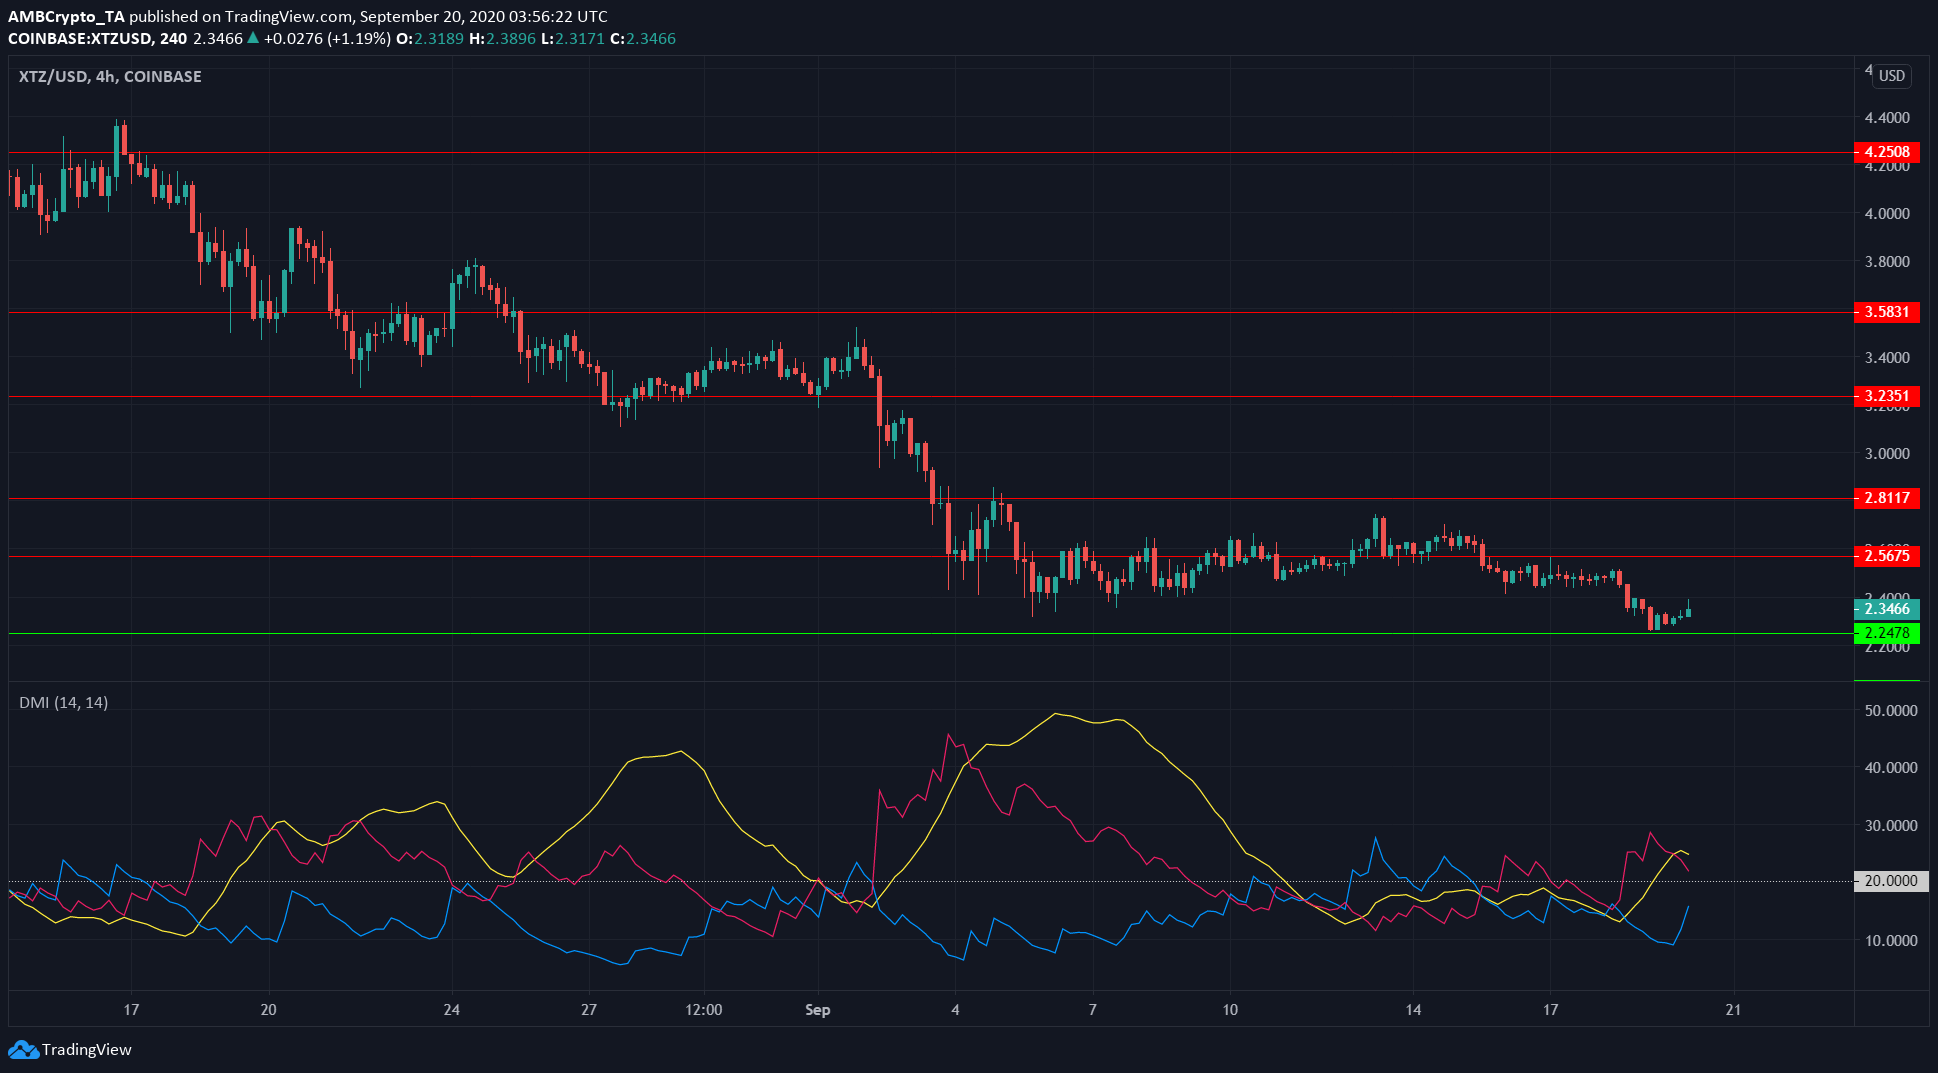
Source: XTZ/USD on TradingView
Tezos tested its resistance level at $2.56 once last week, but did not look likely to surpass the level after that. Subsequently, XTZ dropped to find support at $2.24.
The Directional Movement Index (DMI) showed that the bearish trend was strengthening, as the ADX (yellow) climbed above 20. It is likely that XTZ will continue to slide downwards.
Tezos has also registered lower highs and lower lows for a month now and showed no signs of halting its bearish momentum. The next levels of support for the crypto-asset were at $2 and $1.81.
Waves [WAVES]
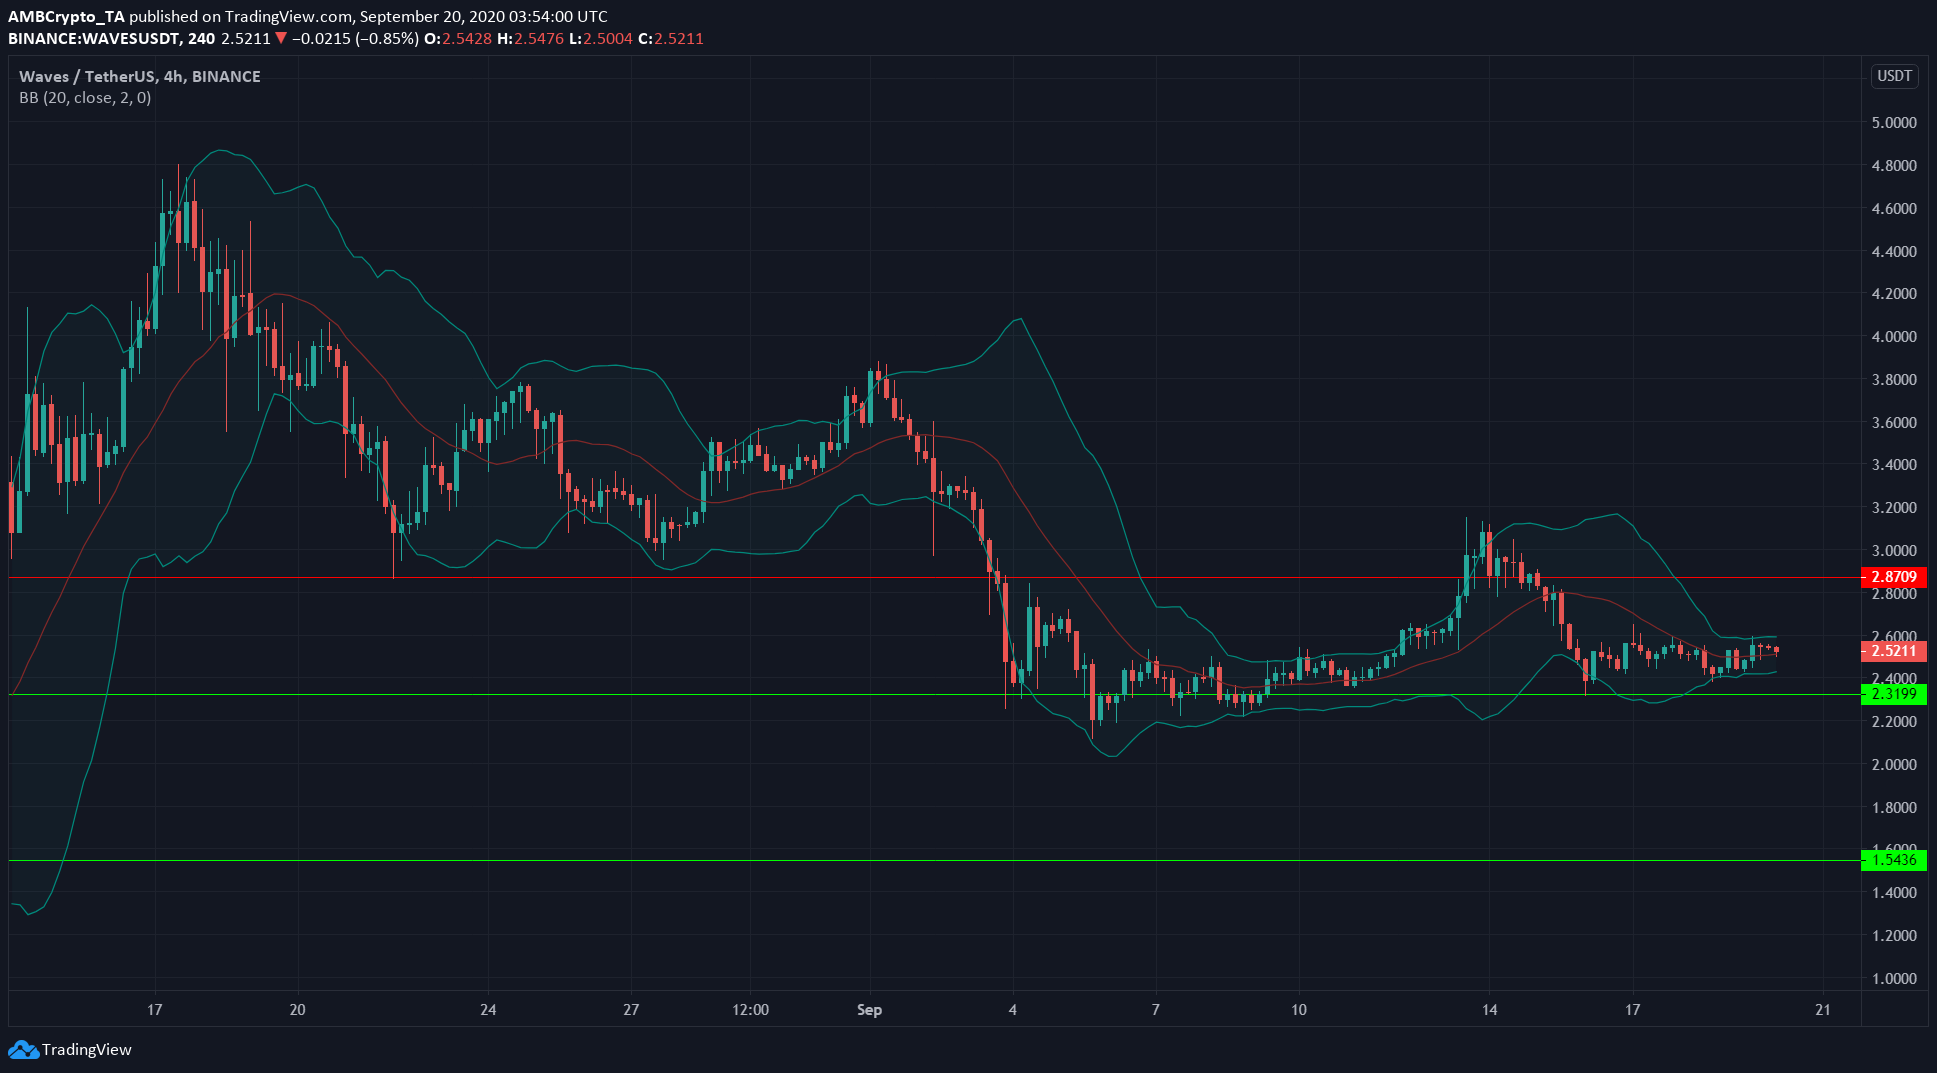
Source: WAVES/USDT on TradingView
WAVES has been in a doldrum for the past few days, with the Bollinger Bands tightening around its price. This observation not only indicated falling volatility but also a period of consolidation.
Support for WAVES lay at $2.32. A breakout, with expanding Bollinger Bands and backed by heavy trading volume, will decide which direction WAVES will take in the future.
WAVES was ranked 57th on CoinMarketCap with a market capitalization of $260 million, at the time of writing. The 24-hour trading volume for the crypto-asset averaged $40 million over the past few days, compared to $114 million on 13 September, a day when the price surged from $2.59 to $3.11.
Zcash [ZEC]
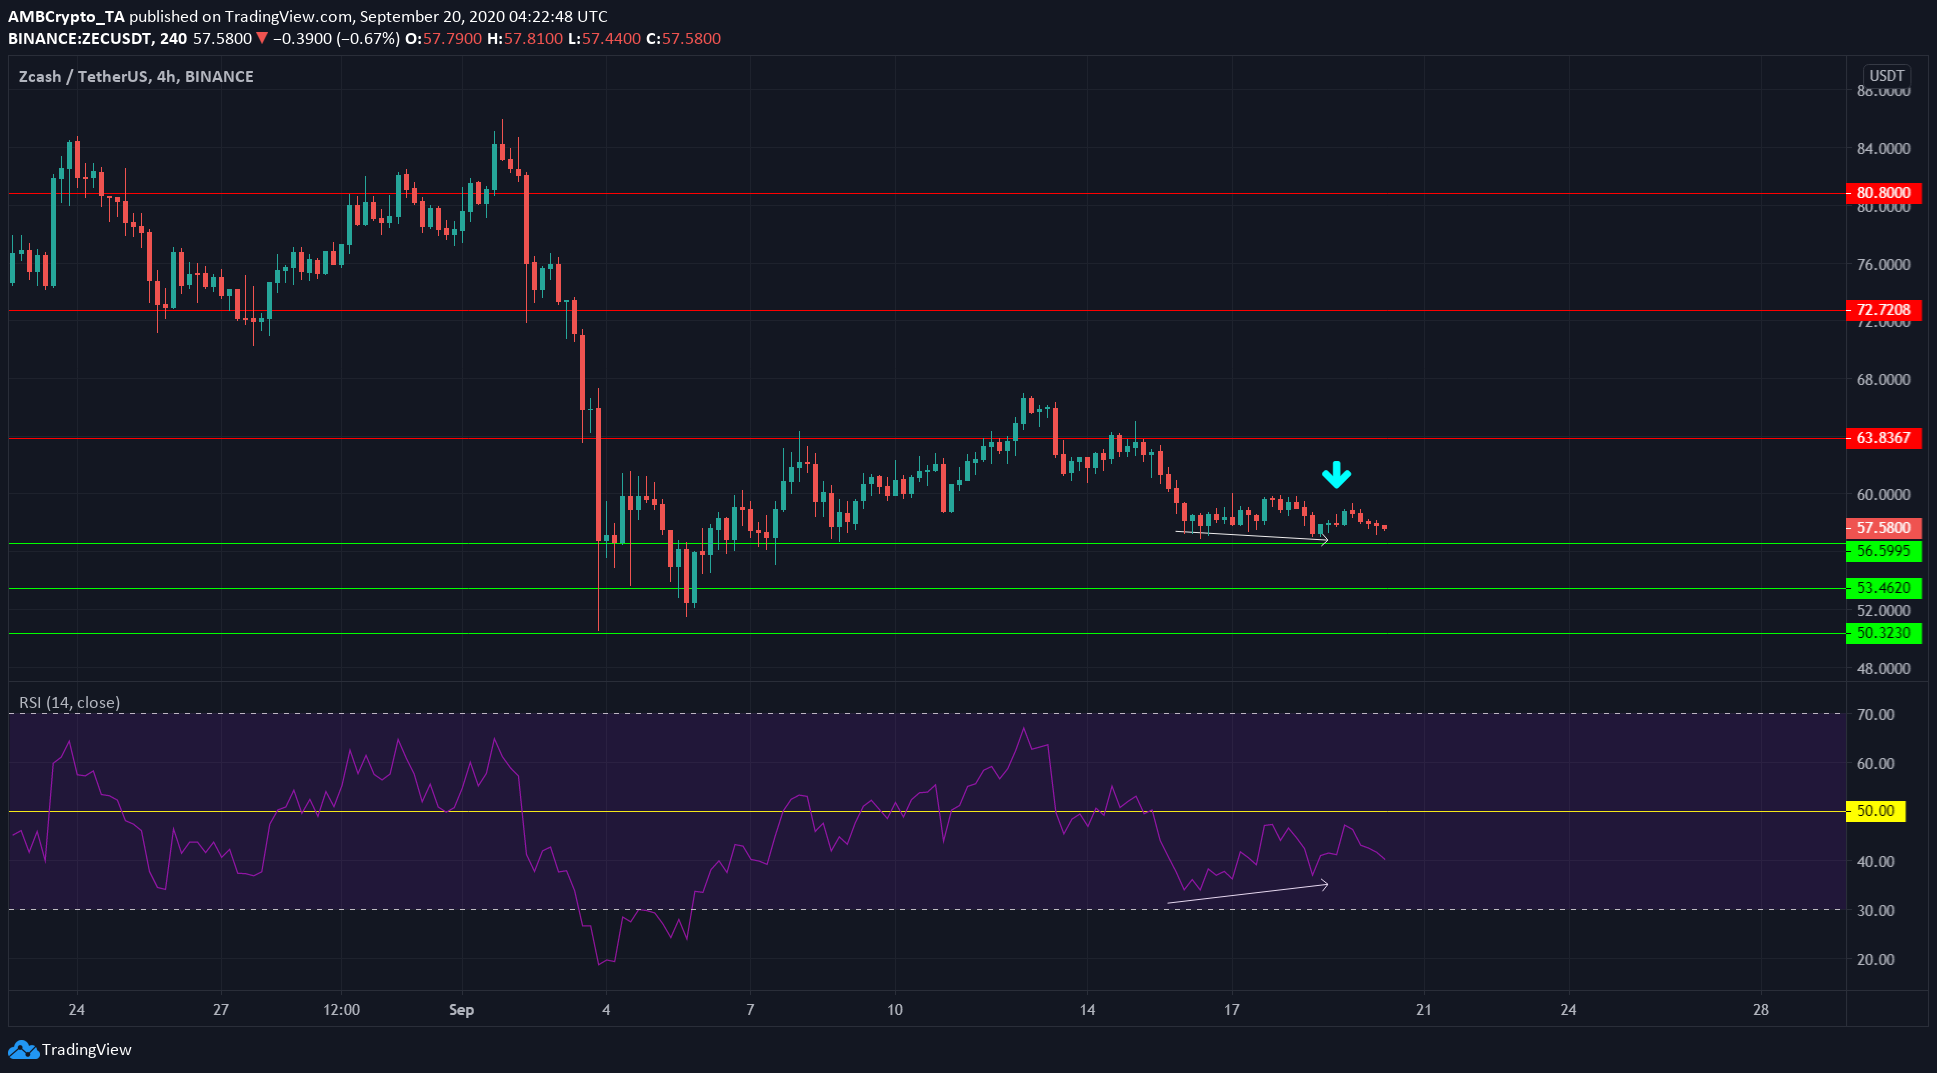
Source: ZEC/USDT on TradingView
Zcash highlighted a bullish divergence on the 4-hour chart, one underlined by the white trendlines. The price formed lower lows, while the momentum indicator (RSI) formed higher lows. However, the divergence may already have been played out, as the price was driven up weakly from $57.3 to $59.3, as shown by the cyan arrow.
Apart from the divergence, the RSI painted a picture of mounting bearish pressure. In fact, the RSI hadn’t risen above 50 over the past week and was noting a bearish value of 40, at the time of writing.