
Disclaimer: The following price prediction should materialize within a week.
XRP’s price action in the past day’s time wasn’t very promising. With the price maintaining its consolidation near $0.29, a steep drop of 8.56% witnessed the asset dropped down to $0.265 in the charts. In the meantime, the asset also breached the immediate support line at $0.284. At press time, XRP’s market cap was observed to be around $12.5 billion with a 24-hour decline percentage of 6.86.
XRP 1-day chart
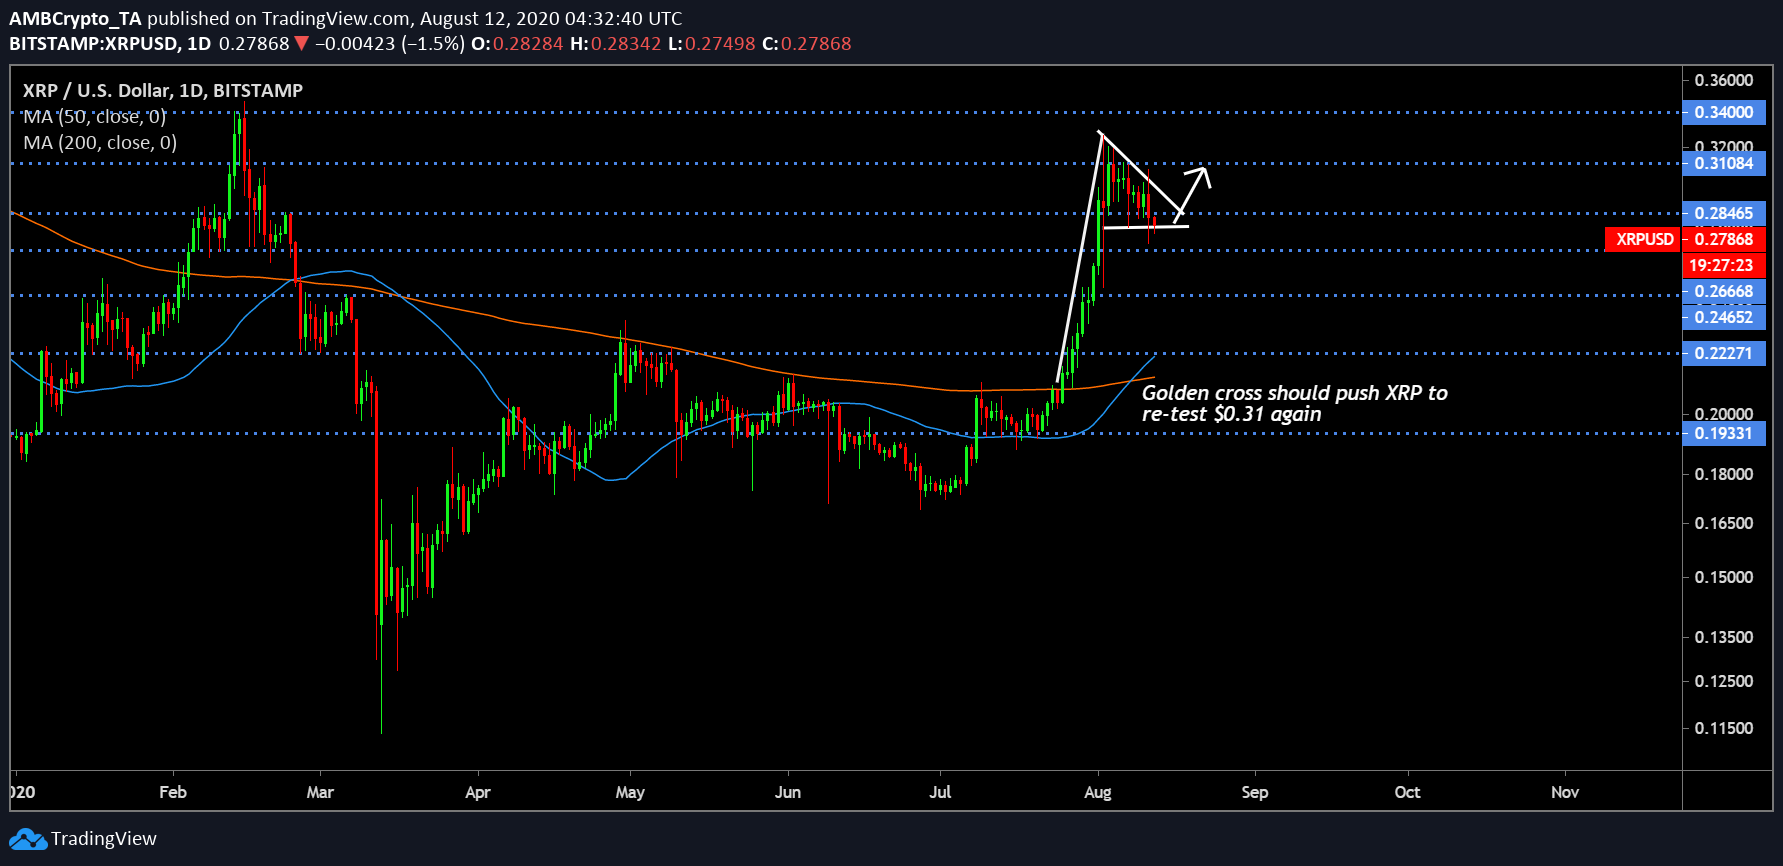
Source: XRP/USD on Trading View
XRP’s one-day chart is currently a contradicting set in terms of pattern formation and price movement. After its astounding rise over resistance at $0.222, $0.246, $0.2666, $0284, and finally $0.310. However, the rally has been short-sighted since then, as XRP’s failure to overcome its yearly highs of February 2020 was identified.
XRP is currently forming a bullish pennant that should have registered a breakout upwards. However, at press time the direction is rather unpopular, dropping below immediate support at $0.284. Now, another bullish pattern that was pictured on 7th August, was the arrival of the Golden Cross moment. The movement of 50-Moving Average over the 200-Moving Average is essentially a key bull rally sign since the crossover, XRP has been rather bearish than bullish.
There is still a possibility for XRP tp reverse this trend and acquired momentum from the Golden Cross move would allow the asset to possibly re-test $0.301 again.
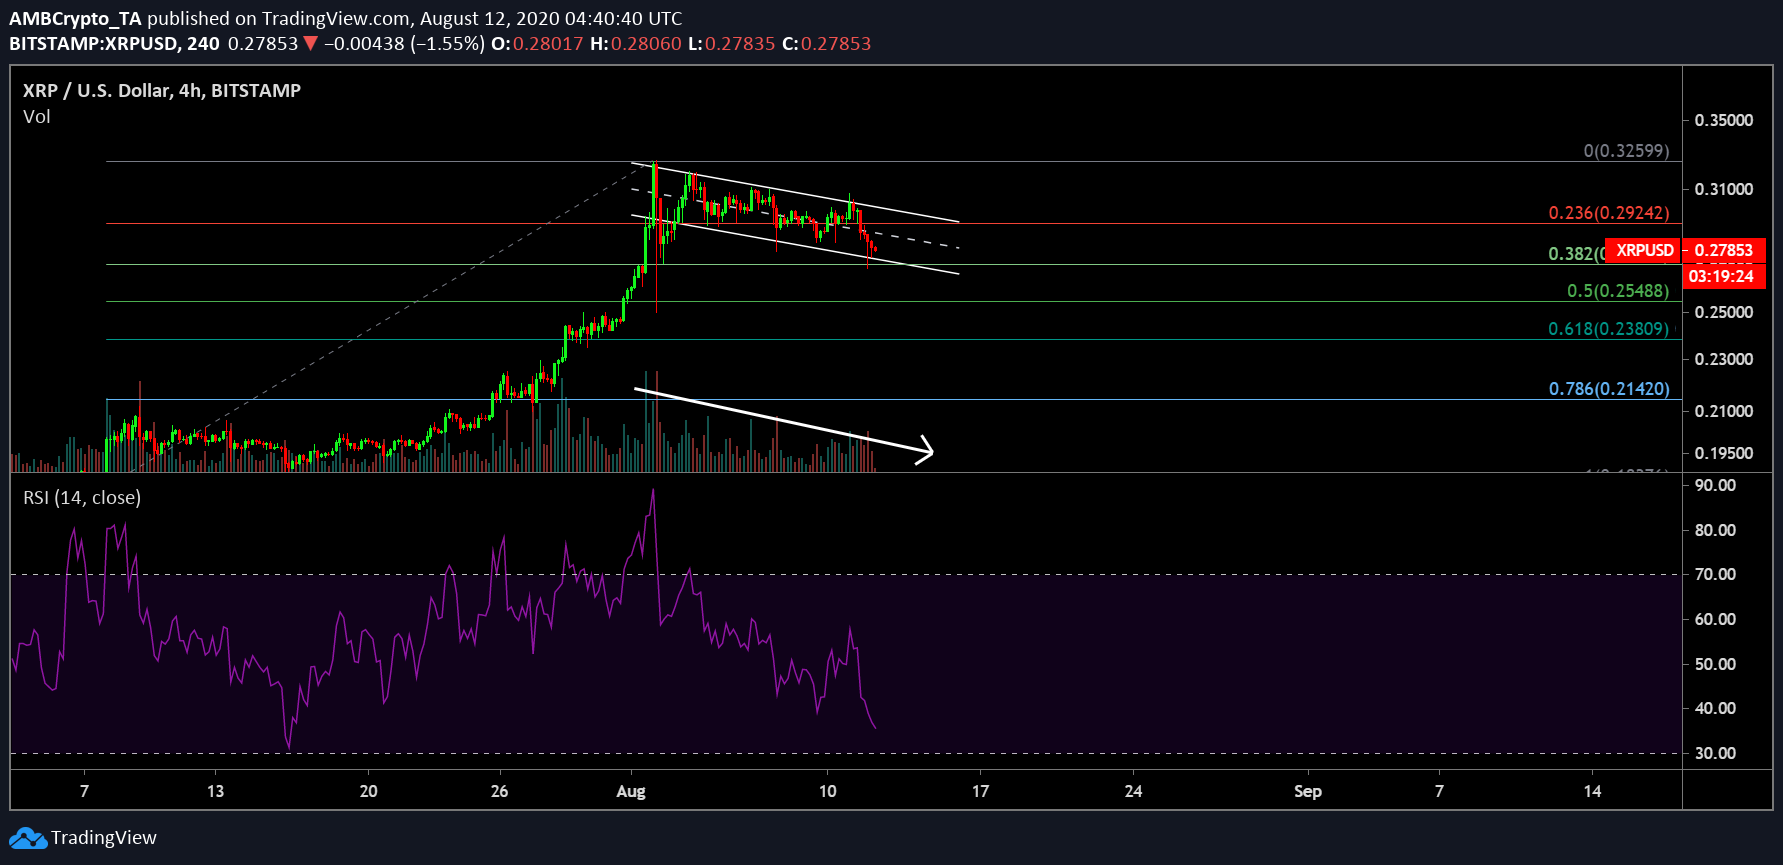
Source: XRP/USD on Trading View
With the 4-hour chart, there is further clarity in terms of pattern formation. Currently, XRP is under a descending channel and it is moving towards the Fibonacci retracement at 0.382 i.e $2.64. The immediate resistance identified by the Fibonacci line is at $0.292 but the asset would need to break into the upper half of the pattern.
Now, few positives on the side in the decreasing trading volume, indicative that an imminent pushback in terms of activity will pump the valuation in the charts. Relative Strength Index or RSI was extremely bearish as well but fairly close to the oversold zone hence a trend reversal is definitely in the cards of XRP over the next week.
Conclusion
XRP will possibly maintain its movement under $0.284 for the next few days before breaking above in under a week’s time.